Blog · 15 minutes read
Typescript compiler performance

TypeScript has become a go-to choice for many developers due to its strong typing and scalability benefits. However, as our projects grow, so do the potential performance bottlenecks.
Why should you care
TypeScript performance impacts these places:
- tsc --noEmit - usually this command is running in CI to ensure that project has no typing issues. Shaking several seconds off is nice, but does not provide much impact.
- TypeScript eslint - it's an extension of additional rules which require AST with typing information. Lint issues are also usually checked on CI server, but it is also enabled on IDE to run on each save action.
- TypeScript language server (Intellisense) - it is responsible for autocomplete in your IDE. It also runs on each save/action.
My main goal is to have good Developer experience - having a fast feedback loop. This is the reason why a slow IDE is not acceptable for productive development. So if you notice that IDE takes quite a long to mark errors or provide code suggestions - this might be a good indication to analyze how typechecking is performing.
Examples from open source
In recent years, it is much more common to see merge requests related to TypeScript performance. It is a great source to analyze how other projects are dealing with this problem.
Redux - 60% check time decrease.
Ant design - 30% check time decrease.
Zod - 35% check time decrease.
Sentry - 18% check time decrease.
When you start to face type checking speed problems
Usually, this happens when you try to express something complex. Some of the most common culprits:
- Large unions
- Recursive types
- Nested types
- Inheritable props
Diagnosis
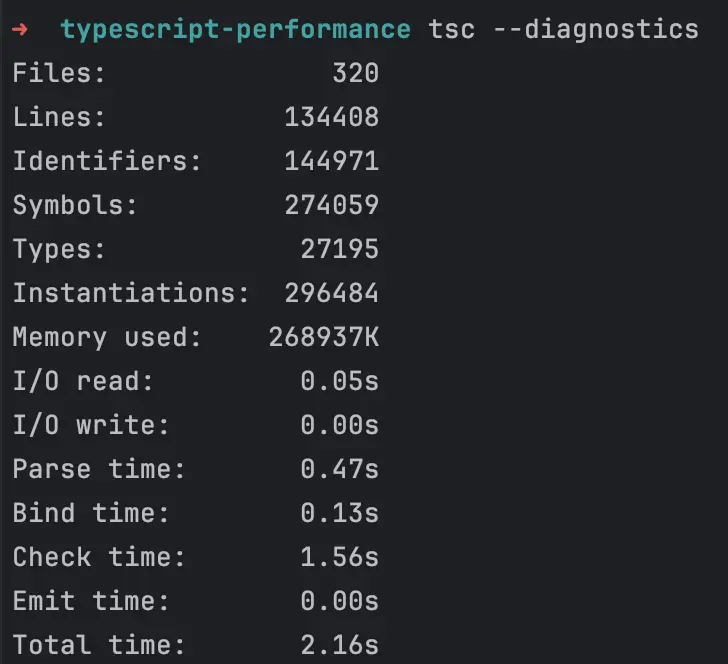
tsc --diagnostics is a great tool to get type checking statistics. While it does not provide any evaluations, it can point you in the right direction - f.e. maybe you are including too many files.
tsc --extendedDiagnostics provides more information, but I rarely find this information useful.
tsc --generateTrace traceDir is a most powerful tool. It generates 2 files trace.json and types.json
trace.json file contains timing information about operations TypeScript had to perform to evaluate project codebase.
types.json file is used when you need to map sourceId from trace.json to exact type in your codebase.
After getting trace.json file, you need to upload it to the flame graph tool. The most popular tool is Perfetto. But at least I prefer to use Speed scope due to its better UX.
Example case 1
After you import trace.json file, you should see a nice flame chart. It can be divided into 3 parts:
- create program
- bind source file
- check source file
In this blog post, I am mostly focusing on the last part, which is responsible for the check time metric.
When looking at flamegraph it is important to focus on 2 things
- Deep bars - means that TypeScript had to perform a lot of nested type comparisons. Possibly related to type unions, recursions, etc. Sometimes types are complex on their own but can be performant and just take less than 50ms.
- Wide bars - means that typechecking takes a long time. This is what you should try to tackle first.
Note: TypeScript usually marks the very first time a complex type was encountered as a wide bar. I had this issue with Material UI. The first file in project tree which imported material UI was marked as taking a long time to calculate. Removing material ui imports, type checking time simply transferred to the next place which had this import.
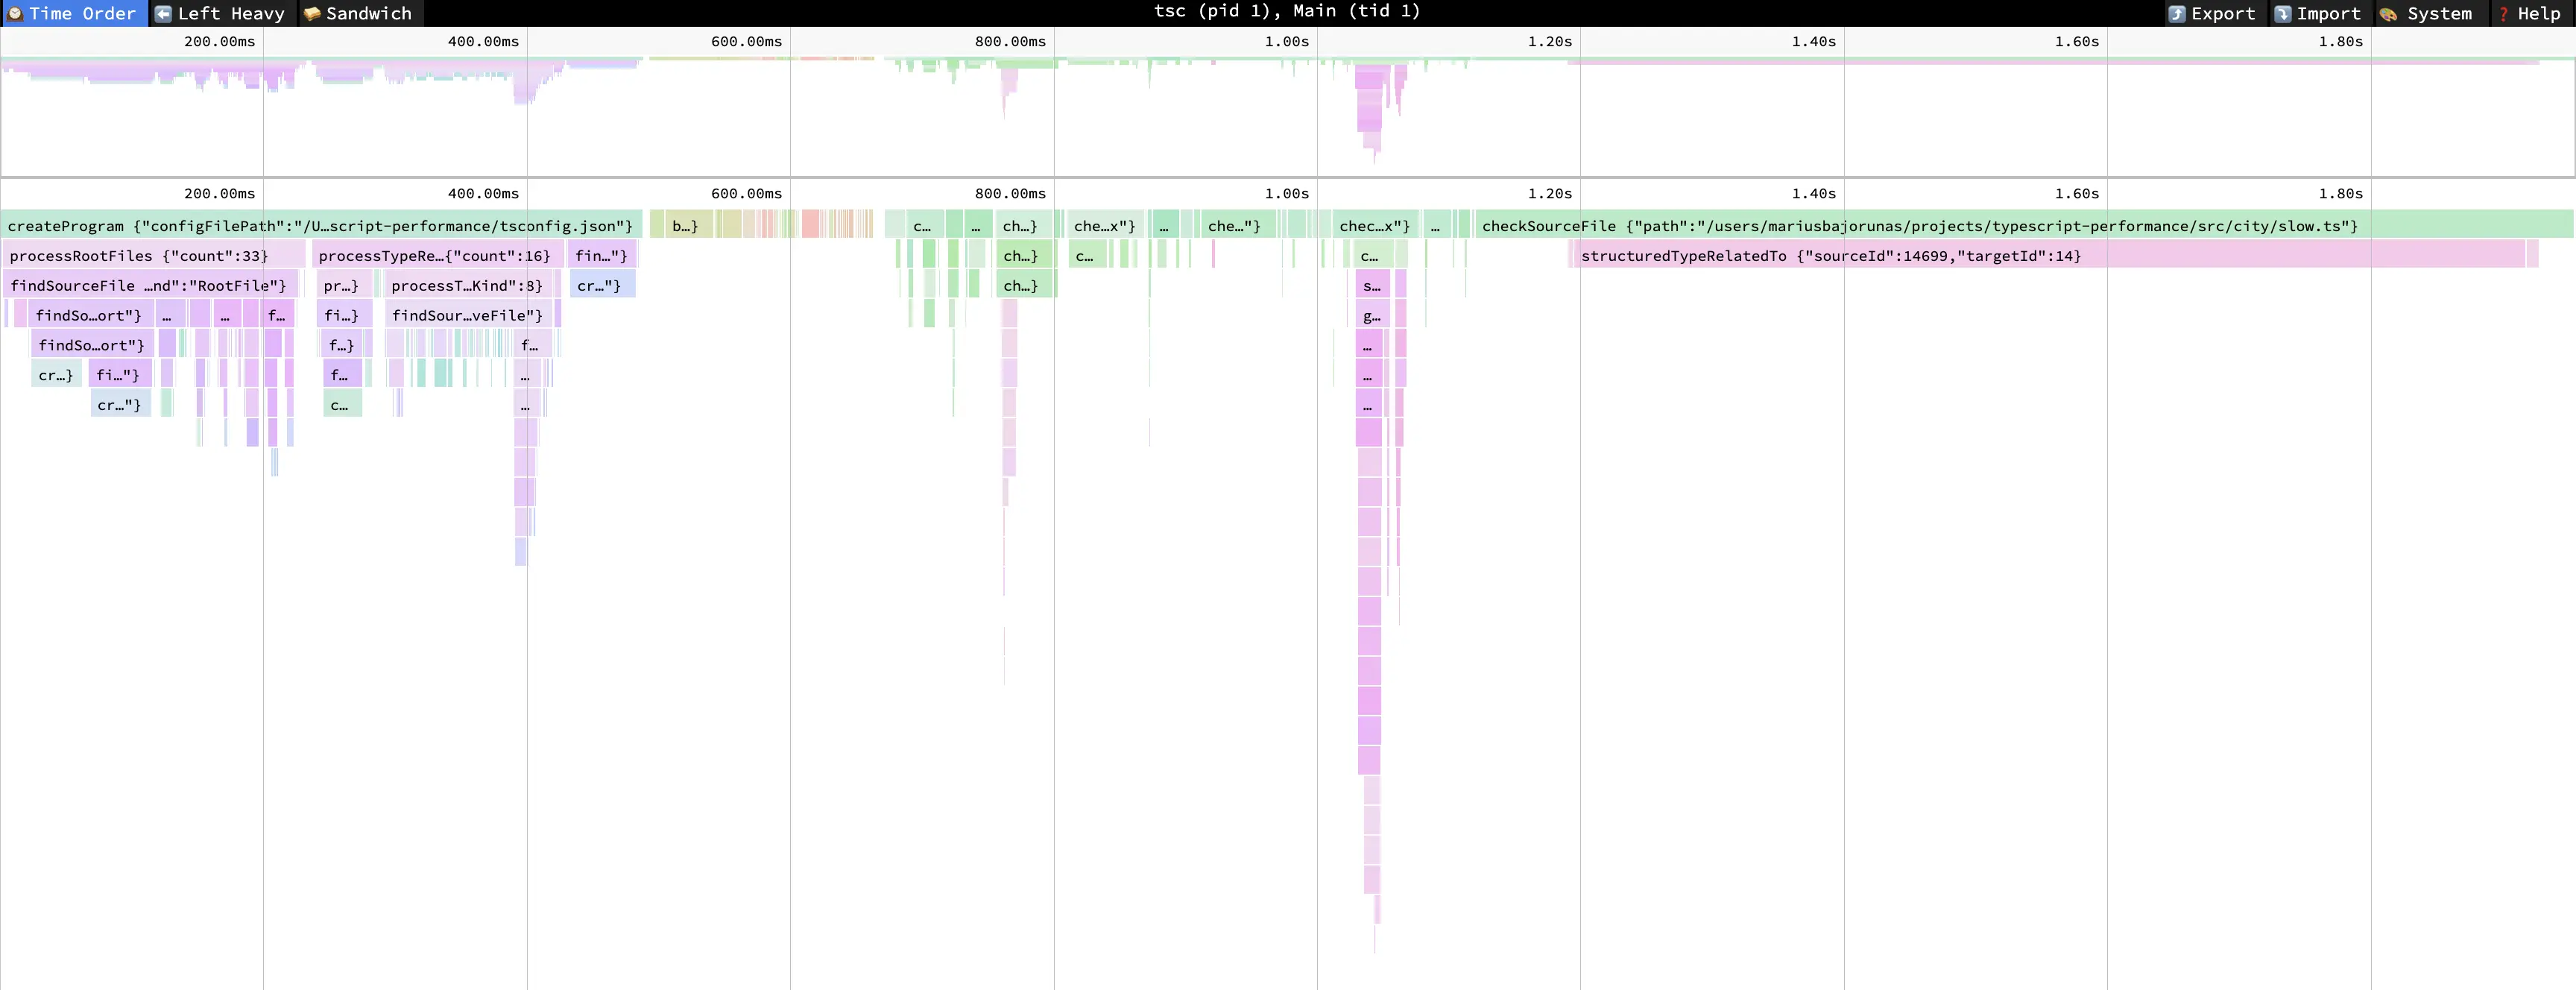
From the provided screenshot, you should notice that there is a wide cell for file slow.ts.
In that file, we have i18n solution which I wrote about in the blog article Typescript template literals.
1export type MessageKey = keyof Translations;
2
3export type Translator = <Key extends MessageKey>(
4  key: Key,
5  // Key check needed, because if invalid key is passed, it resolves to any and returns invalid error message
6  ...[options]: Key extends MessageKey ? TranslationOptions<SlotKeysExtractor<Translations[Key]>> : never
7) => string;
It has quite complex calculations trying to extract required params for translation message. By itself, the code was working quite well, until we reached 2000+ message keys.
To debug this we can use an inner trace cell called structuredTypeRelatedTo {"sourceId":14699,"targetId":14}. sourceId and targetId can be found in types.json file. After searching for these IDs, we find{"id":14699, "symbolName":"MessageKey", "unionTypes":[...manyOtherIds], "flags":["Union"]}.
The root cause is that we have MessageKey, which is a large union of 2000 items. Inside this generic function, it is again checked if Key extends MessageKey. This results in 2 000 * 2 000 = 4 000 000 checks for TypeScript. No wonder it takes quite a bit of time to analyze this.
Let's try to remove this inner Key extends MessageKey check, and rerun generateTrace command.
1export type MessageKey = keyof Translations;
2
3export type Translator = <Key extends MessageKey>(
4  key: Key,
5  ...[options]: TranslationOptions<SlotKeysExtractor<Translations[Key]>>
6) => string;
Type checking becomes noticeable faster and in flame chart slow.ts file type checking time was reduced from ~800ms to ~50ms. Huge impact!
Now TypeScript only has to perform 2 000 checks. But part of the code was removed, so it no longer checks one case it previously did.
To overcome this, it can be rewritten as function overload. The idea is to split this function into 2 - one which handles case when translation message has no translation params, and another one which has.
To utilize TypeScript caching it is best to precalculate these types as smaller types.
1type MessageKey = keyof Translations;
2
3type MessagesParams = { [key in MessageKey]: SlotKeysExtractor<Translations[key]> };
4type MessagesWithParams = {
5  [key in MessageKey as MessagesParams[key] extends never ? never : key]: MessagesParams[key];
6};
7type MessageKeysWithParams = keyof MessagesWithParams;
8type MessageKeysWithoutParams = Exclude<MessageKey, MessageKeysWithParams>;
9
10type TranslatorWithParams = <Key extends MessageKeysWithParams>(
11  key: Key,
12  options: Record<MessagesWithParams[Key], string | number>,
13) => string;
14
15type TranslatorWithoutParams = <Key extends MessageKeysWithoutParams>(key: Key) => string;
16
17export type Translator = TranslatorWithParams & TranslatorWithoutParams;
Now it has the same feature parity as an original solution, while also being fast (~70ms).
Example case 2
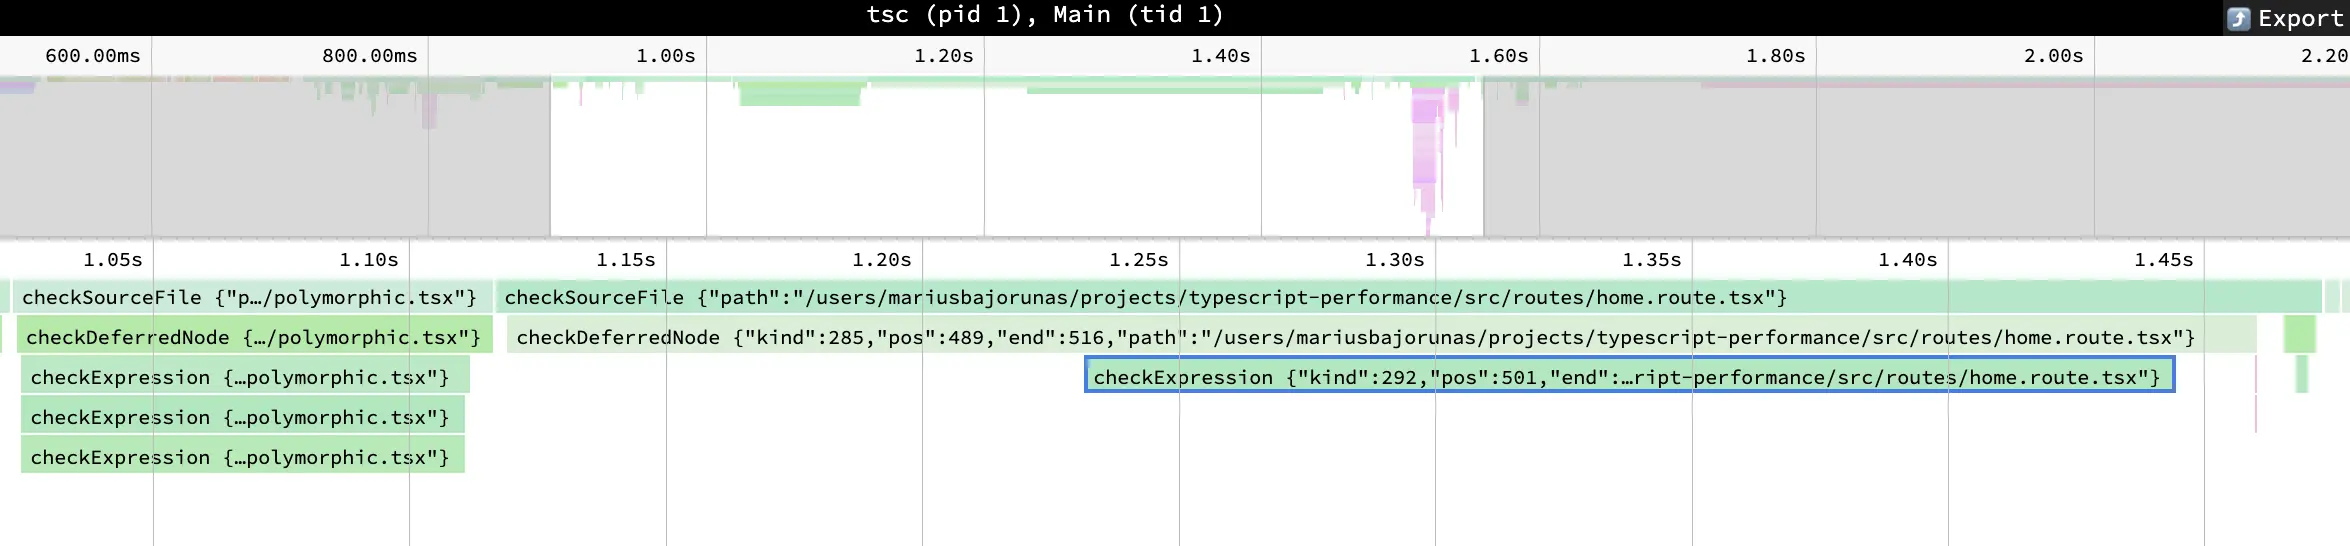
In this case, there are 2 inner cells. One is called checkDeferredNode {"kind":285, "pos":489, "end":516, "path":"/src/routes/home.route.tsx"} and checkExpression {"kind":292, "pos":501, "end":513, "path":"/src/routes/home.route.tsx"}. This time they point to a specific position in file. It is defined by offset from file start - from 501 to 513 symbol.
To find the exact place, it is possible to use IDE "go to" functions. I prefer JetBrains tools, and this feature is hidden by default. It requires to add idea.is.internal=true to enable it.
After searching for this position, it points to place<Polymorphic as="button" />.
1import { JSX } from 'react';
2
3// <Polymorphic as="button" />
4export const Polymorphic = <Key extends keyof JSX.IntrinsicElements>(
5  props: {
6    as: Key;
7  } & JSX.IntrinsicElements[Key],
8) => {
9  return <div id={props.id}>{props.as}</div>;
10};
11
The main idea of the Polymorphic components is that they let to pass element tag you want to render as a prop. Additionally, it allows to pass other props, which are possible for that element type.
But this comes at its own cost. JSX.IntrinsicElements is an interface of all possible HTML element tags (~180) with their allowed properties type (~100-350). This results approximately in 180 * 300 = 54 000 checks - a similar case like in example case 1.
There are 2 ways to improve this:
- Limit possible elements list. Maybe we do not need all 180 elements, but just 2 elements - button and anchor is enough. This would change the equation to
2 * 300 = 600checks. - Limit available props count. In our specific example, just the
idproperty is being used, so we can usePicktype helper to just select relevant props. This would change the equation to180 * 1 = 180checks.
The best way would be to combine these 2 solutions, which would result in 2 * 1 = 2 checks (instead of 54 000).
1import { JSX } from 'react';
2
3// <Polymorphic as="button" />
4export const Polymorphic = <Key extends 'button' | 'a'>(
5  props: {
6    as: Key;
7  } & Pick<JSX.IntrinsicElements[Key], 'id'>,
8) => {
9  return <div id={props.id}>{props.as}</div>;
10};
11
After this change, check time was decreased from ~450ms to ~20ms!
Overall, after both improvements check time of the project decreased from decreased by 66% (from 1.8s to 0.6s).
Recommendations
Measure - like with all performance optimizations, it is important to get accurate numbers that your changes have improved anything.
Upgrade TypeScript - with each version, TypeScript improves its compilation speed. From my personal experience, jumping a few minor versions has decreased project compilation time by ~20%. This is also the easiest way, without the need to do any trace analysis.
Avoid large unions - this is one of the most common causes of slow compilation speed. But do you need to have large unions in the first place? Maybe it makes sense to have a smaller subset.
Extract to type helpers - doing this helps TypeScript to cache calculations. So if you have complex type declarations, try splitting them into smaller chunks.
Use interfaces when combining types - this recommendation is present in TypeScript performance documentation. I could not find any example cases online that would demonstrate big differences. I have tried to create cases with 50 combinations, but performance was pretty much the same. Maybe in some cases, it could solve some issues.
Read an official guide on performance tracing - it can give some additional ideas which I have not mentioned in this blog post.
Summary
Usually, TypeScript is fast by itself, but in some cases, it can slow you down. I hope that this post will help to diagnose and fix possible problems and that you will be up to speed again.